A Different BMI Formula

Should there be a different BMI formula? Many have suggested that it would be better to come up with a formula different than either the body mass index which is based on the scaling of weight to the power of two or the formula known as the Ponderal Index which is based on the weight being a factor based on the power of three. The cube root (power of three) is the most natural of relationships for objects that increase in size. For example if you double the side of a 1 inch cube to make it a 2 inch cube it will have a volume of 2*2*2 or 2³ or 8 cubic inches. If that cube was of uniform weight it would have 8 times as much weight. If you double a person’s height would you not expect you would double their weight?
Here are some pictures to represent the problem. Think of one brick as some one 5 feet tall and 120 pounds. How much would this person weigh if they were 10 feet tall?

If all proportions were exactly the same this person would weigh eight times as much or be 960 pounds.

But taller people do not have the same proportions as shorter people. Are they simply stretched? If so they would be 240 pounds.
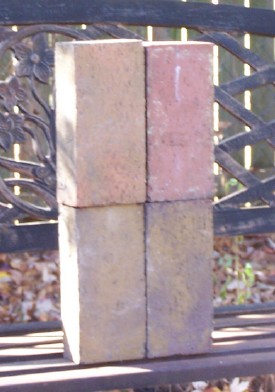
Would they be squared as the BMI formula suggests? If so they would weigh about 480 pounds.
The BMI formula was first observed using some data that was observed on men hundreds of years ago. Let us look at some more recent data which was taken from the 1960 census a time when obesity was not such a big problem. I will try to show the comparison in a visual form. I will also try to show whether a different number between a square (2) and a cube (3) would be more appropriate to use an exponent. It has been suggested that a number between 2.3 and 2.7 would be better.¹ Of course I realize that this analysis was looking at all of the people in 1960 and to make a decision requires looking only at the weight of healthy people, and I do not know where that data is.
Why do I use the 1960 data? Because as the chart below indicates, there were fewer overweight people in 1960.
Table 2. Age-adjusted* prevalence of overweight,
obesity and extreme obesity among U.S. adults, age 20-74 years**
| | NHES I | NHANES I | NHANES II | NHANES III | NHANES | NHANES | NHANES | NHANES |
| Overweight (BMI
greater than or equal to 25.0 and less than 30.0) | 31.5 | 32.3 | 32.1 | 32.7 | 33.6 | 34.4 | 33.4 | 32.2 |
| Obese (BMI
greater than or equal to 30.0) | 13.4 | 14.5 | 15.0 | 23.2 | 30.9 | 31.3 | 32.9 | 35.1 |
| Extremely obese
(BMI greater than or equal to 40.0) | 0.9 | 1.3 | 1.4 | 3.0 | 5.0 | 5.4 | 5.1 | 6.2 |
*Age-adjusted by the direct method to the
year 2000 U.S. Bureau of the Census estimates using the age groups
20-39,
40-59, and 60-74 years.
**NHES: National Health Examination Survey;
NHES included adults 18-79 years, NHANES I & II did not include
individuals
over 74 years of age, thus trend estimates are based on age 20-74
years.
Pregnant females were excluded from analyses.
http://www.cdc.gov/nchs/data/hestat/overweight/overweight_adult.htm
If you look at the next chart, you can see that the BMI formula (power of 2) gives a better fit than the Ponderal Index (power of 3). For the power of 3 to be a better fit it would have to give more similar numbers irrespective of a person’s height.
You can also see that the number that gives the most consistent results irrespective of a persons height is the BMI formula to the power of 1.8 rather than to the power of two.
| BMI of Ave Men (1960 25-34 yrs) (Smoothed average Table 5 NCHS "Weight by Height and Age of Adults") | ||||||||||
| height | weight | BMI (power 2) | power 2.5 | power 3 (PI) | power 2.2 | power 1.8 | power 2.1 | power 1.9 | power 1.85 | power 1.75 |
| 74 | 194 | 24.90787043 | 18.16786 | 13.251687 | 21.9545 | 28.25854 | 23.38461 | 26.53036 | 27.38081767 | 29.164394 |
| 73 | 190 | 25.06722089 | 18.4089 | 13.519157 | 22.15516 | 28.36204 | 23.56625 | 26.66379 | 27.49980882 | 29.2513108 |
| 72 | 186 | 25.22587612 | 18.65362 | 13.793677 | 22.35697 | 28.46292 | 23.74814 | 26.79556 | 27.61666238 | 29.3351161 |
| 71 | 181 | 25.24411702 | 18.79811 | 13.998069 | 22.43581 | 28.40394 | 23.79858 | 26.77746 | 27.57871295 | 29.2538615 |
| 70 | 177 | 25.39659502 | 19.04626 | 14.283799 | 22.63545 | 28.49455 | 23.97631 | 26.90102 | 27.68632146 | 29.3263783 |
| 69 | 172 | 25.39969916 | 19.18612 | 14.492582 | 22.70346 | 28.41614 | 24.01377 | 26.86562 | 27.63000693 | 29.224647 |
| 68 | 168 | 25.54405047 | 19.43652 | 14.789284 | 22.89925 | 28.49432 | 24.18552 | 26.97889 | 27.72625148 | 29.2836644 |
| 67 | 163 | 25.52914713 | 19.5696 | 15.001262 | 22.9538 | 28.39344 | 24.20725 | 26.92323 | 27.64856427 | 29.158383 |
| 66 | 159 | 25.66300807 | 19.82069 | 15.308404 | 23.14366 | 28.45661 | 24.3708 | 27.02373 | 27.73091556 | 29.2012857 |
| 65 | 154 | 25.62667817 | 19.9443 | 15.521913 | 23.18157 | 28.32968 | 24.37348 | 26.94431 | 27.62831353 | 29.0488593 |
| 64 | 150 | 25.74717699 | 20.19402 | 15.838569 | 23.36291 | 28.37477 | 24.52609 | 27.02906 | 27.69374392 | 29.0725443 |
| 63 | 145 | 25.6853336 | 20.30477 | 16.051327 | 23.38031 | 28.2176 | 24.50574 | 26.92171 | 27.56203949 | 28.8887518 |
| 62 | 141 | 25.78897261 | 20.55045 | 16.37603 | 23.54989 | 28.24094 | 24.64402 | 26.98712 | 27.60691334 | 28.8895244 |
| hi - low | 0.881102189 | 2.382586 | 3.1243436 | 1.595396 | 0.276953 | 1.259411 | 0.498703 | 0.35009789 | 0.44636437 | |
| 62 -74 | 0.881102189 | 2.382586 | 3.1243436 | 1.595396 | -0.0176 | 1.259411 | 0.456763 | 0.226095667 | -0.27486959 | |
| ave BMI | 25.44813428 | |||||||||
Therefore, this data suggests that if we must change the BMI formula it should be to the power of 1.8 rather than the 2.2 or 2.3 that has been suggested. The real kicker is that no one has a good set of data for healthy people just data for average people. When we get better data, then perhaps the formula can be changed. Perhaps we should start keeping records of those people who live to be at least 90 and then go back in time to see how tall and how much they weighed when they were young.
| BMI of Ave Women (1960 25-34 yrs) (Smoothed average Table 5 NCHS "Weight by Height and Age of Adults") | |||||||||||
| height | weight | BMI (power 2) | power 2.5 | power 3 (PI) | power 1.50 | power 1.8 | power 2.1 | power 1.9 | power 1.70 | power 1.60 | power 1.4 |
| 68 | 156 | 23.71947544 | 18.04819 | 13.732906 | 31.17284 | 26.45901 | 22.45799 | 25.05182 | 27.94524163 | 29.5149554 | 32.92385 |
| 67 | 152 | 23.80632125 | 18.24896 | 13.988907 | 31.05607 | 26.47732 | 22.57363 | 25.10632 | 27.92317806 | 29.4479928 | 32.75197 |
| 66 | 148 | 23.88757984 | 18.44945 | 14.249332 | 30.92865 | 26.48791 | 22.68477 | 25.15417 | 27.89237191 | 29.3713029 | 32.56857 |
| 65 | 144 | 23.96260816 | 18.64921 | 14.513996 | 30.78985 | 26.49009 | 22.79079 | 25.19468 | 27.85211682 | 29.2841697 | 32.37295 |
| 64 | 140 | 24.03069852 | 18.84775 | 14.782664 | 30.63891 | 26.48312 | 22.89101 | 25.22713 | 27.80164556 | 29.1858181 | 32.16434 |
| 63 | 136 | 24.09107151 | 19.04447 | 15.055038 | 30.47497 | 26.46616 | 22.98469 | 25.25071 | 27.74012391 | 29.0754084 | 31.94189 |
| 62 | 132 | 24.14286798 | 19.23872 | 15.330752 | 30.29714 | 26.43833 | 23.07099 | 25.26454 | 27.66664397 | 28.9520301 | 31.70473 |
| 61 | 128 | 24.18514007 | 19.42973 | 15.609359 | 30.10443 | 26.39863 | 23.149 | 25.26766 | 27.58021659 | 28.814695 | 31.45189 |
| 60 | 124 | 24.21684108 | 19.61666 | 15.890316 | 29.89579 | 26.34599 | 23.21769 | 25.25899 | 27.47976294 | 28.6623291 | 31.18232 |
| 59 | 120 | 24.23681401 | 19.79852 | 16.172971 | 29.67006 | 26.27923 | 23.27593 | 25.23737 | 27.36410502 | 28.4937639 | 30.89491 |
| 58 | 116 | 24.24377861 | 19.9742 | 16.456543 | 29.426 | 26.19707 | 23.32245 | 25.20151 | 27.23195511 | 28.3077267 | 30.58844 |
| 57 | 112 | 24.23631669 | 20.14245 | 16.7401 | 29.16224 | 26.09807 | 23.35585 | 25.14997 | 27.08190375 | 28.1028294 | 30.26159 |
| hi - low | 0.524303171 | 2.094257 | 3.0071938 | 2.0106 | 0.392028 | 0.897868 | 0.215833 | 0.863337872 | 1.41212601 | 2.662262 | |
| 68-57 | 0.51684125 | 2.094257 | 3.0071938 | -2.0106 | -0.36094 | 0.897868 | 0.098147 | -0.863337872 | -1.41212601 | -2.66226 | |
More Appropriate Exponent for BMI
Nick Korevaar has suggested that an exponent of between 2.3 and 2.7 would be more accurate than the present exponent of 2.0¹
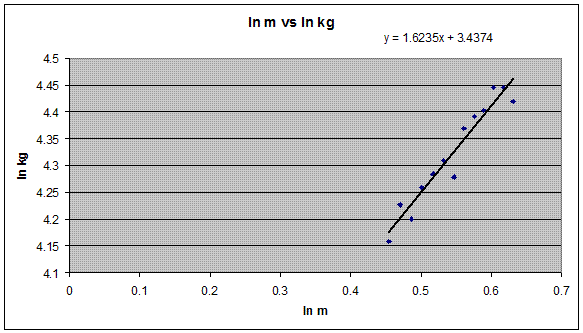
. The proplem is that his analysis only looked at the BMI of growing children and not adults. I am looking for a better exponent for adults. So far I have only given a visual explaination and a look at the data. I will now use the same math as explained by Korevaar, but using exel to find the best exponent for adults. I will start with the last example of data, women 25 to 34.
| BMI of Ave Women (1960 25-34 yrs) (Smoothed average Table 5 NCHS "Weight by Height and Age of Adults") | |||||
| height | weight | ht m | wt kg | ln ht(m) | Ln wt(kg) |
| 68 | 156 | 1.72720 | 70.76041 | 0.54650 | 4.25930 |
| 67 | 152 | 1.70180 | 68.94604 | 0.53169 | 4.23332 |
| 66 | 148 | 1.67640 | 67.13167 | 0.51665 | 4.20666 |
| 65 | 144 | 1.65100 | 65.31730 | 0.50138 | 4.17926 |
| 64 | 140 | 1.62560 | 63.50293 | 0.48588 | 4.15109 |
| 63 | 136 | 1.60020 | 61.68856 | 0.47013 | 4.12210 |
| 62 | 132 | 1.57480 | 59.87419 | 0.45413 | 4.09225 |
| 61 | 128 | 1.54940 | 58.05982 | 0.43787 | 4.06147 |
| 60 | 124 | 1.52400 | 56.24545 | 0.42134 | 4.02973 |
| 59 | 120 | 1.49860 | 54.43108 | 0.40453 | 3.99694 |
| 58 | 116 | 1.47320 | 52.61671 | 0.38744 | 3.96303 |
| 57 | 112 | 1.44780 | 50.80235 | 0.37005 | 3.92794 |
This chart shows what we saw by exploring the data. For this category, which is women 25 to 34, an exponent of lower than 2.0 would be better. In this case 1.62 would be better.
I have run this test on other age groups and for both men and women. I get results for and exponent of from 1.1 to 1.8. None of these seem to be of tremendous advantage over 2.0 which never seems to be off by more than about a half a BMI value.
Summary:
It has been shown that for adults an exponent of less than 2.0 seems to be slightly better. Others have show that for children and young people, a BMI exponent of greater than 2.0 would be best. The problem with both studies is that the data includes a variety of body types and not only healthy people but also people who are over weight and underweight. Also there would have to be a seperate exponent for each age group. In conclusion, until there is much better data, It would be best to just keep the exponent at 2.0. Even though it is not a perfectly reliable indicator of obesity, it gives the medical professional a starting point for discussion, and as it does combine height and weight into one number.
Related Resources at Ideal-Weight-Charts.com
Go back to the BMI Chart for Men and Women.
Need more information about how BMI charts for men and BMI charts for women change with age?
Chart for Women only? BMI Chart for Women
More General Information about the Body Mass Index Chart?
See how the BMI chart compares to other ideal weight charts.
See what John Barban has to say about BMI Charts.
New! Comments
Have your say about what you just read! Leave me a comment in the box below.