Body Mass Index Formula
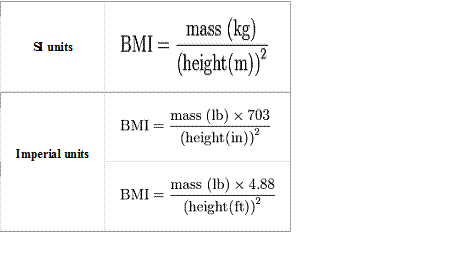
The body mass index formula gives the body mass index (BMI), or Quetelet index, is a measure which compares a person's weight and height. Though the body mass index formula does not actually measure the percent of body fat, it is used to estimate a healthy weight based on a person's height. Due to its ease of measurement and calculation, BMI is the most widely used diagnostic tool to identify weight problems within a population It was invented between 1830 and 1850 by Adolphe Quetelet a Belgian. Body mass index is defined as the individual's body weight divided by the square of his or her height. The formulae universally used in medicine produce a number with units in kg/m². BMI can also be determined using a BMI chart. or you can use the formula below:
While the BMI formula dates to the 19th century, the term "body mass index" for the ratio and its popularity date to a 1972 paper by Ancel Keys, which found the BMI to be the best way to estimate body fat percentage among the various ratios of weight and height. This interest in measuring body fat being due to obesity becoming a obvious issue in prosperous Western societies. BMI was explicitly cited by Keys as being appropriate for population studies, and inappropriate for individual diagnosis. Nevertheless, due to its simplicity, BMI came to be widely used for individual diagnosis, despite its inappropriateness.
BMI provided a simple numeric measure of a person's "fatness" or "thinness", allowing Doctors and other health professionals to discuss over- and under-weight problems more objectively with their patients. However, BMI is now controversial because many people, including physicians, have come to rely on its apparent numerical authority for medical diagnosis, but that was never the BMI's purpose; it is meant to be used as a simple means of classifying sedentary (physically inactive) individuals with an average body composition. For these individuals, the current value settings are as follows: a BMI of 18.5 to 25 may indicate optimal weight; a BMI lower than 18.5 suggests the person is underweight while a number above 25 may indicate the person is overweight; a BMI below 17.5 may indicate the person has anorexia or a related disorder; a number above 30 suggests the person is obese (over 40, morbidly obese).Now a little math to show why some people think that there should be a 3 (cubed) in the formula rather than a 2 (squared)
If we double the height of this
cube
(person) to 2 inches then:

If these cubes were made of the same material then the cube that doubled its height would have a weight that was 8 times (2³) as much as the smaller cube. This is why the BMI formula is not accurate.
If you took the weight of a person that was 3 feet tall and the weight of someone who had the same shape that was six feet tall, the weight of the taller person should be about 8 times as much.
Does that make sense? Let us see. If you go to the cdc site http://apps.nccd.cdc.gov/dnpabmi/calculator.aspx and plug in for a male 3 feet and 30 ¾ pounds one gets a BMI of 16.7 which would be too small for an adult but is about average for a child (53ʳᵈ percentile). Take 30¾ times 8 = 246 pounds which is not bad for a six foot man.
If the BMI was correct then:
That 6 foot man that was twice as tall should weight four times (2x2) as much as the 3 foot child or 30 ¾ x 4 = 123 pounds. Too Skinny!
This is why another scale was invented called the Ponderal index PI.
We already saw the Body Mass Index formula problems start to show up for very tall people and very short people. It results in taller people having a reported BMI that is uncharacteristically high compared to their actual body fat levels. Very short people ie children will have low BMIs in comparison to their fat level. Now the problem with the Pondeal index: Tall people are not just "scaled up" short people, but tend to have narrower frames in proportion to their height. It has been suggested that instead of squaring the body height (as the BMI does) or cubing the body height (as the Pondeal index does), it would be more appropriate to use an exponent of somewhere between 2.3 to 2.7, but alas too many people are using the BMI. Just like SI units are better than Imperial units but too many people are using them.
Another problem (in case no one has noticed) is that men and women are not shaped alike…indeed no one is shaped alike…..Use these charts as a starting place only.
Keep weighing but remember: There are other ways to measure weather or not you are in shape:
% Fat
Body Measurements
Blood pressure
How many push ups
How fast am I?
How much can I lift?
Do you float easily?
Blood sugar
cholesterolHow do I feel?
PS Here is how to interpret BMI:
| Category | BMI range – kg/m² |
| Severely underweight | less than 16.5 |
| Underweight | from 16.5 to 18.4 |
| Normal | from 18.5 to 24.9 |
| Overweight | from 25 to 30 |
| Obese Class I | from 30.1 to 34.9 |
| Obese Class II | from 35 to 40 |
| Obese Class III | over 40 |
If
you run the body mass index formula and find that you are obese, the
categories above make for excelent goals. For example if you have a BMI
of 45, your first goal is under 40, second under 35, third under 30 and
finally under 25. Once you get to a normal weight you can refine your
goal by coming back to this site to study % fat, ideal body
measurements, and other goals.