Your Ideal Weight Loss Chart
Monthly
Calendar, Weight Loss Calenday, Control Chart ? As you can
see; the terminology gets confusing, but I think many people would call
this a weight loss chart or when it has been filled in a weight loss
graph or called a control chart by some statisticians.
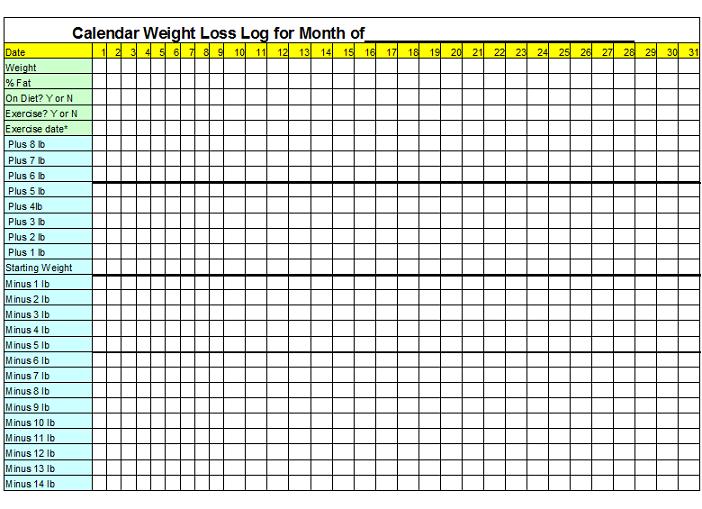
Now
let us look at the Monthly Calendar/control chart. If you
are using your Daily Journal Form to stay accountable for what you eat
the numerical results should be showing up on this Monthly Calendar
Form. Here you can chart your progress day by day through out the
month. It is very important to try and weigh yourself every day so that
you remind yourself that you are on a diet. This is the time you record
whether or not you stuck to the diet that day and whether or not you
exercised that specific day. Just check off in the appropriate column
and day what specifically applies to your situation that day. You can
then see for yourself what progress you are making or what changes need
to take place to meet your yearly goals.
Notice that
there is a place to record your % fat. This is not necessary and indeed
most scales are not very accurate yet, but this is an important thing
to check every now and then. It is especially important for men to use
this as a way of seeing how they are doing. Most men want to be bigger
but not fatter. When you see the % fat you know which it is.
Remember
that some fat is very good. Skin is mostly fat for example. So don’t
attempt to cut all fat out of your diet. It is important to keep your
body burning fat from both food and body fat. 10% fat is usually
considered very athletic. If you get much lower than this you may need
to consult a Physician or trainer and find a better way to measure fat.
How fast should one lose weight?
If one looks at the example of the monthly chart it appears
to be a loss of about 13 pounds, but this was the start of the diet and
we really do not look at about the first 5 pounds. So it appears 8
pounds were loss in this example month. Still a loss of 8 pounds is a
lot. 1-2 pounds is a reasonable amount of weight to loss per week but
you will have to decide what is reasonable and sustainable and what is
not.
Quality Control Enfluenced Weight Loss Chart
Here are a couple of weight loss charts that are influenced by my years as a Quality Engineer. Sometimes the simplest things make the most difference. When there is a problem in a manufacturing environment, the first thing to do is to track the problem. Amazingly, just tracking the problem can make the problem go away. I am hoping that by tracking your weight, the problem of you weight will go away. There are four charts that follow. Two charts are in metric...therefore kilograms (kg). the other two charts are in pounds (lb). The blue line represents the goal. (either 1/2 kg per week, 1 kg per week, 1 pound per week or 2 pounds per week) the red lines represent the control limits. If you go above the red line try to write down on the chart why you think you went above the line. If you go below the line, slow down...you do not want to be starving your body.
metric weight loss chart one half kg per week (PDF)
metric weight loss chart one kg week (PDF)
weight loss chart one pound week (PDF)
weight loss chart two pound week (PDF)
Here is a chart with examples of how it can be modified. In this case I took three tips and added them to the chart.
weight loss calendar with tips.pdf