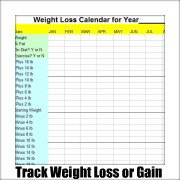
Ideal Weight Chart Journal Calendar and Diary to Maintain and Achieve Your Ideal Body Weight

Start with this ideal weight chart web site, whether you need to lose weight, gain weight, get more muscle or increase your endurance and energy level. Follow the directions tab by tab and section by section to obtain Your Ideal Body.
- Set your goal.
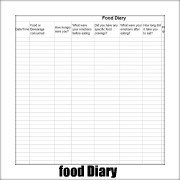
- Find out how to lose or gain weight.
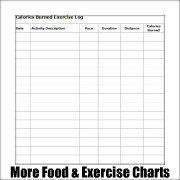
- Find out how to add muscle.
- Get more help to keep you moving in the right direction.
Get
Started Now! The first step is to click on one of the Ideal Weight
Chart tabs. Procrastination and lack of stick-to-it-ness are your
biggest enemies. The plan is simple but the implementation is tough.
Ideal Weight Charts to Help Find Your Weight Goal:
Ideal Weight Charts to Achieve Your Ideal Weight:
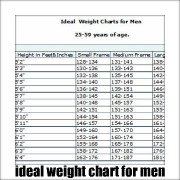
 Most People believe there is
only one Ideal Weight Chart and all they have to do is to look up
their height in this chart and.... Bingo...This is how much I
should weigh.....Wrong! There are many "Ideal Weight Charts"
, but they were never created as ideal weight charts and all had
different purposes. Starting in 1871 with Broca's Index which was
created by a French Surgeon who was more concerned with people starving
to death than obesity. In 1943 the Met Life tables were designed with
the idea of insuring healthy people.
Metropolitan Life Insurance did not care what these healthy people
looked Like.
Most People believe there is
only one Ideal Weight Chart and all they have to do is to look up
their height in this chart and.... Bingo...This is how much I
should weigh.....Wrong! There are many "Ideal Weight Charts"
, but they were never created as ideal weight charts and all had
different purposes. Starting in 1871 with Broca's Index which was
created by a French Surgeon who was more concerned with people starving
to death than obesity. In 1943 the Met Life tables were designed with
the idea of insuring healthy people.
Metropolitan Life Insurance did not care what these healthy people
looked Like.
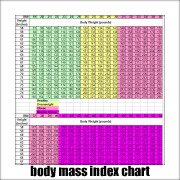
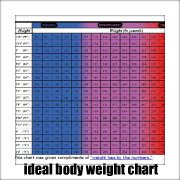
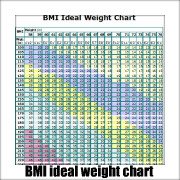
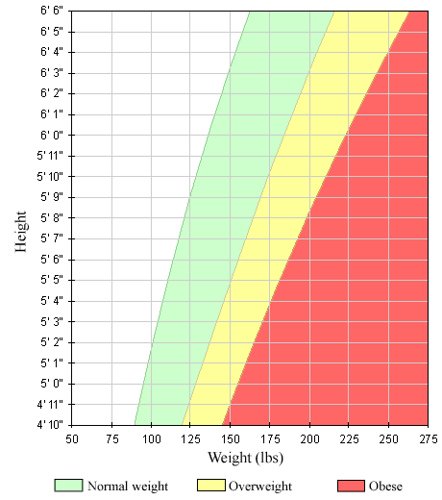
Look at the table or graph below. For most people these are the charts you should use. They use the advice of the CDC who have given BMI of between 18. 5 and 24.9 as being normal or healthy weight.
Here is a pretty chart for those that like some color. It gives the same information as the chart a little further down the page but in a different form.
| Ideal-Weight-Charts.com Ranges For Adults (in pounds) | |||||||
|
Minimum for
all adults
(BMI = 18.5)
|
Maximum for
all adults
(BMI = 24.9)
|
|||||
| 4'8" | 56" | 83 | 111 | ||||
| 4'9" | 57" | 86 | 115 | ||||
| 4'10" | 58" | 89 | 119 | ||||
| 4'11" | 59" | 92 | 123 | ||||
| 5'0" | 60" | 95 | 128 | ||||
| 5'1" | 61" | 98 | 132 | ||||
| 5'2" | 62" | 101 | 136 | ||||
| 5'3" | 63" | 104 | 141 | ||||
| 5'4" | 64" | 108 | 145 | ||||
| 5'5" | 65" | 111 | 150 | ||||
| 5'6" | 66" | 115 | 154 | ||||
| 5'7" | 67" | 118 | 159 | ||||
| 5'8" | 68" | 122 | 164 | ||||
| 5'9" | 69" | 125 | 169 | ||||
| 5'10" | 70" | 129 | 174 | ||||
| 5'11" | 71" | 133 | 179 | ||||
| 6'0" | 72" | 136 | 184 | ||||
| 6'1" | 73" | 140 | 189 | ||||
| 6'2" | 74" | 144 | 194 | ||||
| 6'3" | 75" | 148 | 199 | ||||
| 6'4" | 76" | 152 | 205 | ||||
| 6'5" | 77" | 156 | 210 | ||||
| 6'6" | 78" | 160 | 215 | ||||
| 6'7" | 79" | 164 | 221 | ||||
But even this graph or table is not perfect. As an example short people tend to be stockier and tall people lanky. Also pure math says that weight should increase as a function of the cube and not squared. The charts based on BMI do not even acknowledge a difference between men and women!
Do not use these charts for children or if you are very short or very tall.
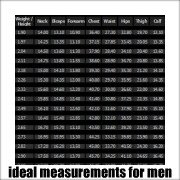
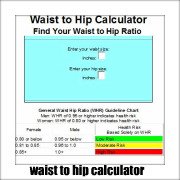
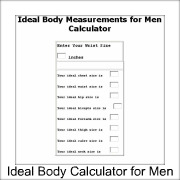
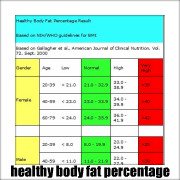
I advise you to go beyond "ideal weight charts and look at the discussions in this website of percent fat and body measurements. In fact as a person gets into better shape, it is always a good idea to look more at measurements and percent fat than to simply look at the charts.
PS. I have a love hate relationship with "ideal weight charts" Ideals can point us in the right direction, but can also rob us of our individuality. Check out the video below:
Stay healthy and happy.